Create and View Gantt Chart
Create a visual timeline of your project using the Gantt chart view. Visualize task schedules, dependencies, and critical paths to manage your project schedule effectively.
This guide is designed for project manager.
Steps
Step 1: Navigate to Programme section
From the sidebar, click Programme (or select from the menu). This is the advanced project scheduling section. By default, it opens in Gantt chart view.
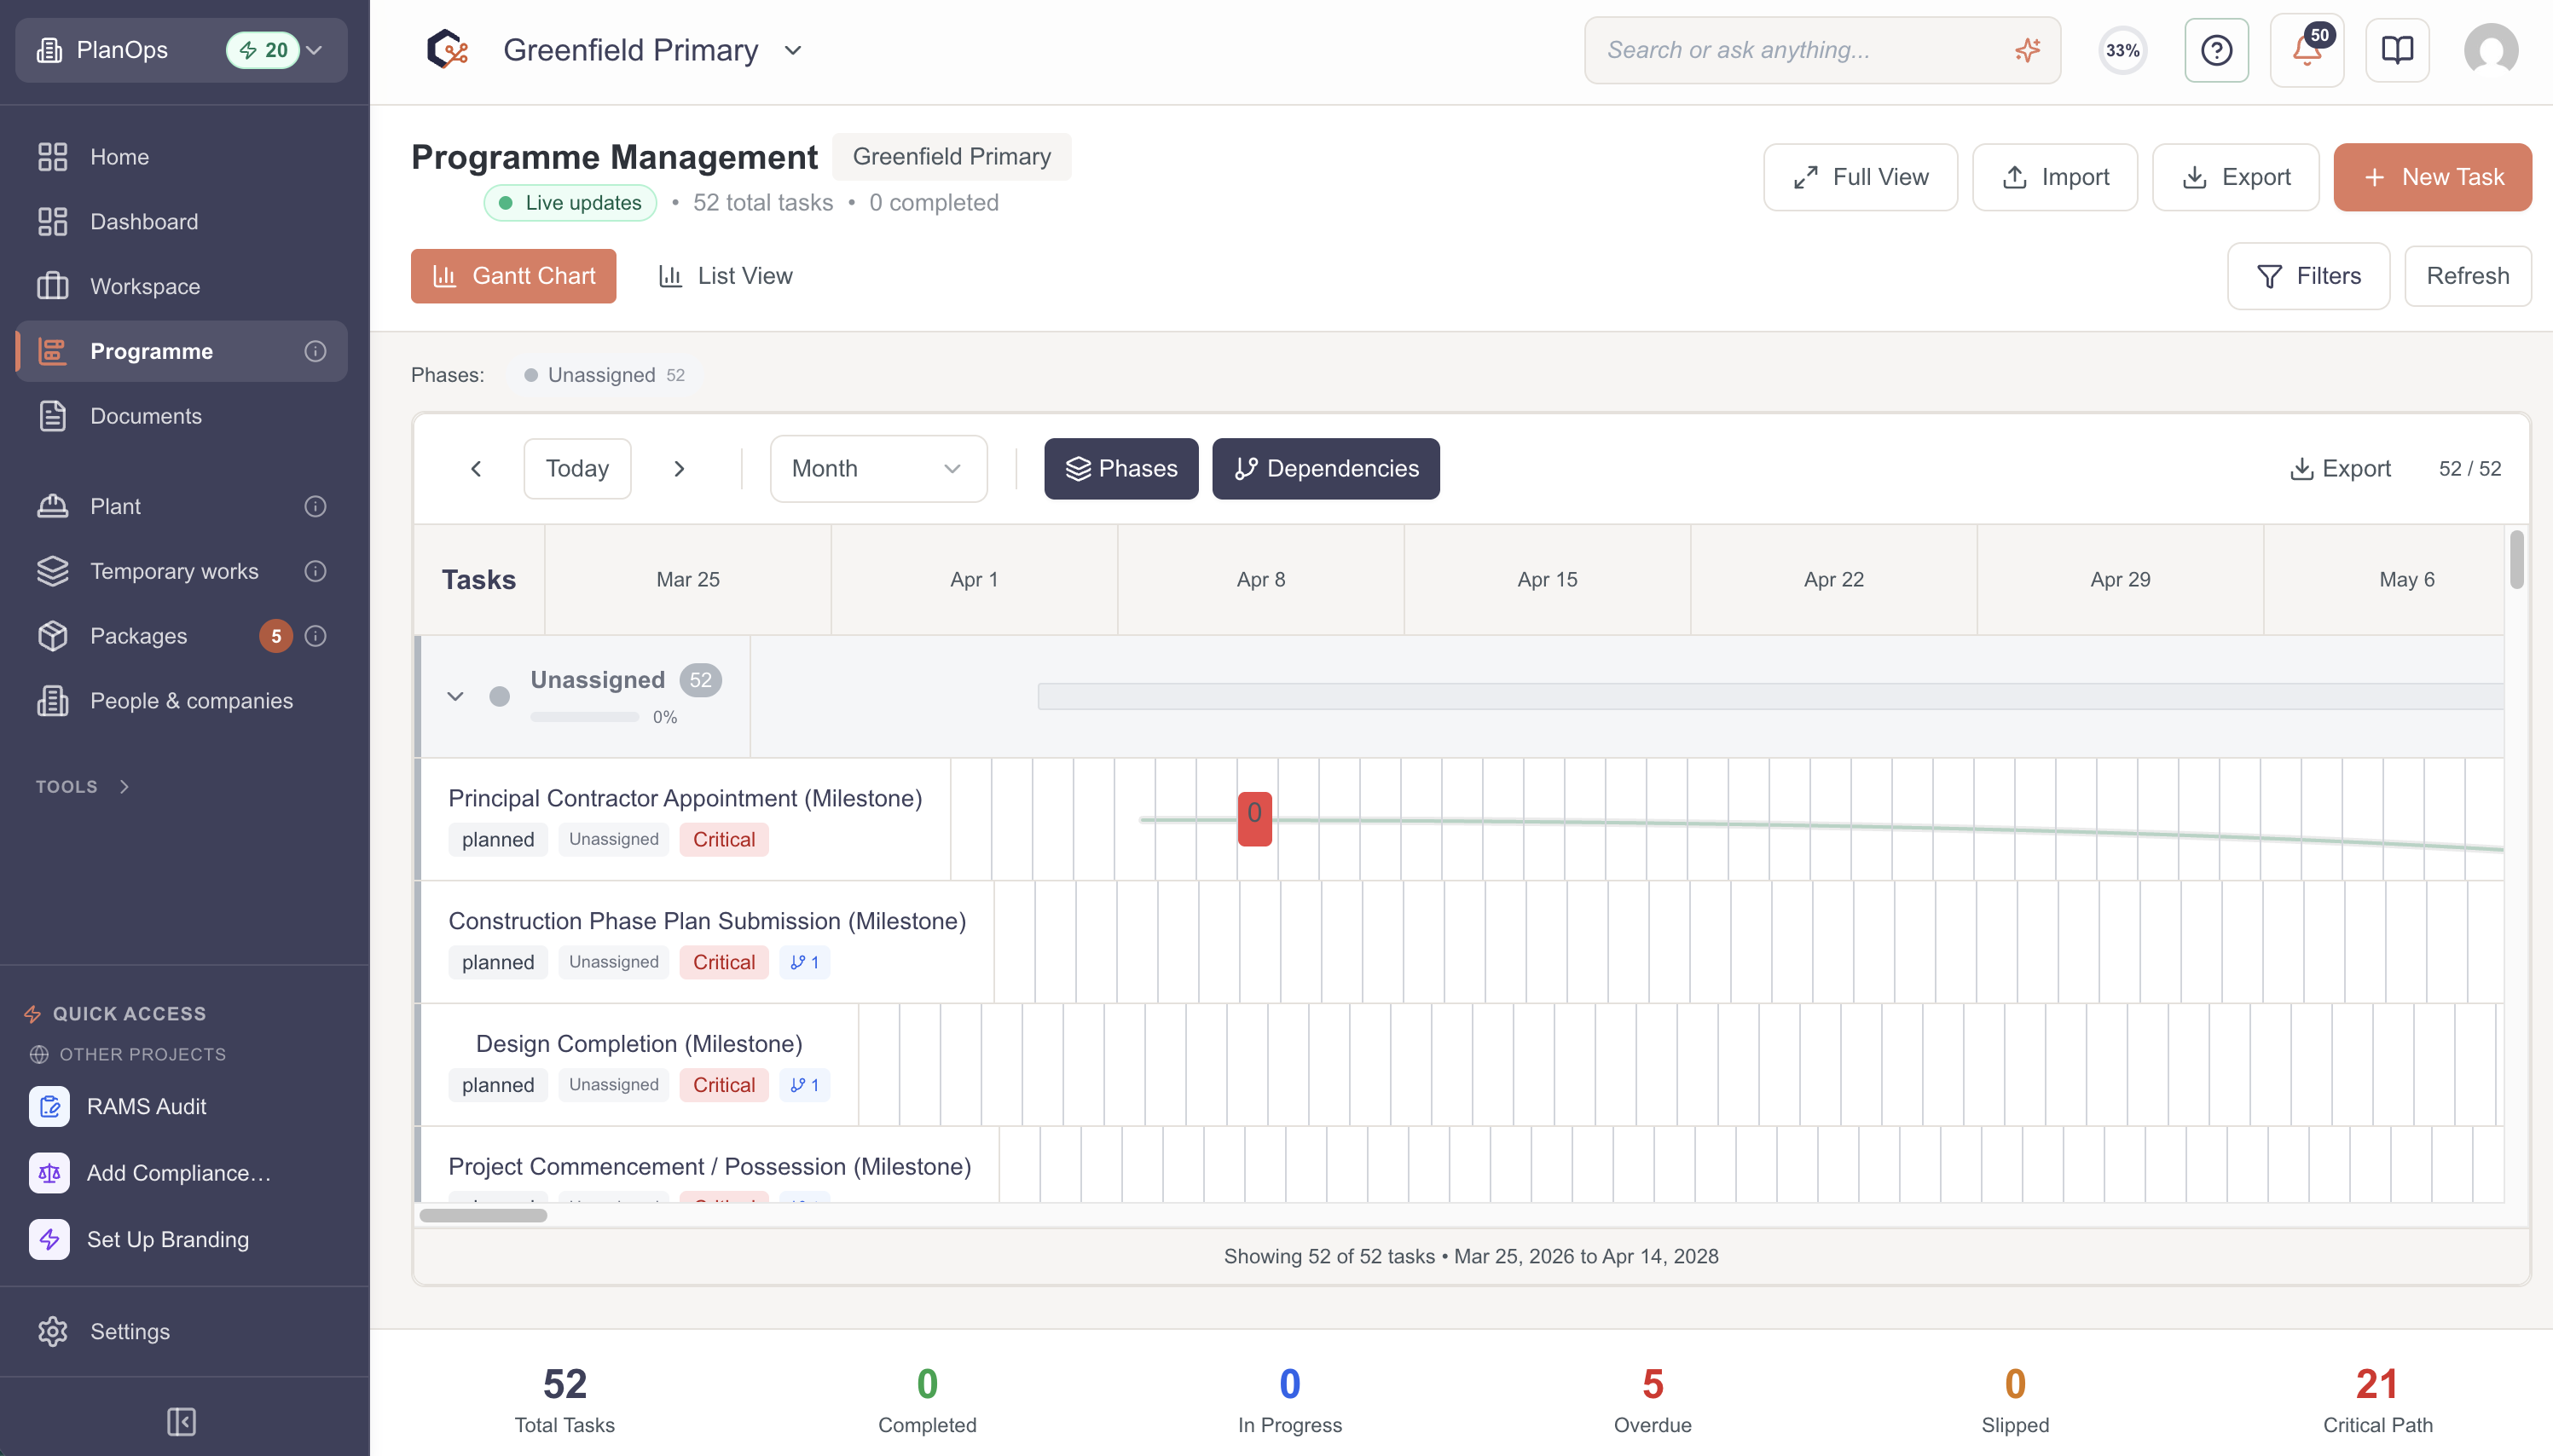
Step 2: View the Gantt chart
The Gantt chart displays all your tasks as horizontal bars on a timeline. Each bar shows the task's duration. The left side lists all tasks, and the right side shows the calendar timeline. Bars aligned vertically show tasks happening at the same time.
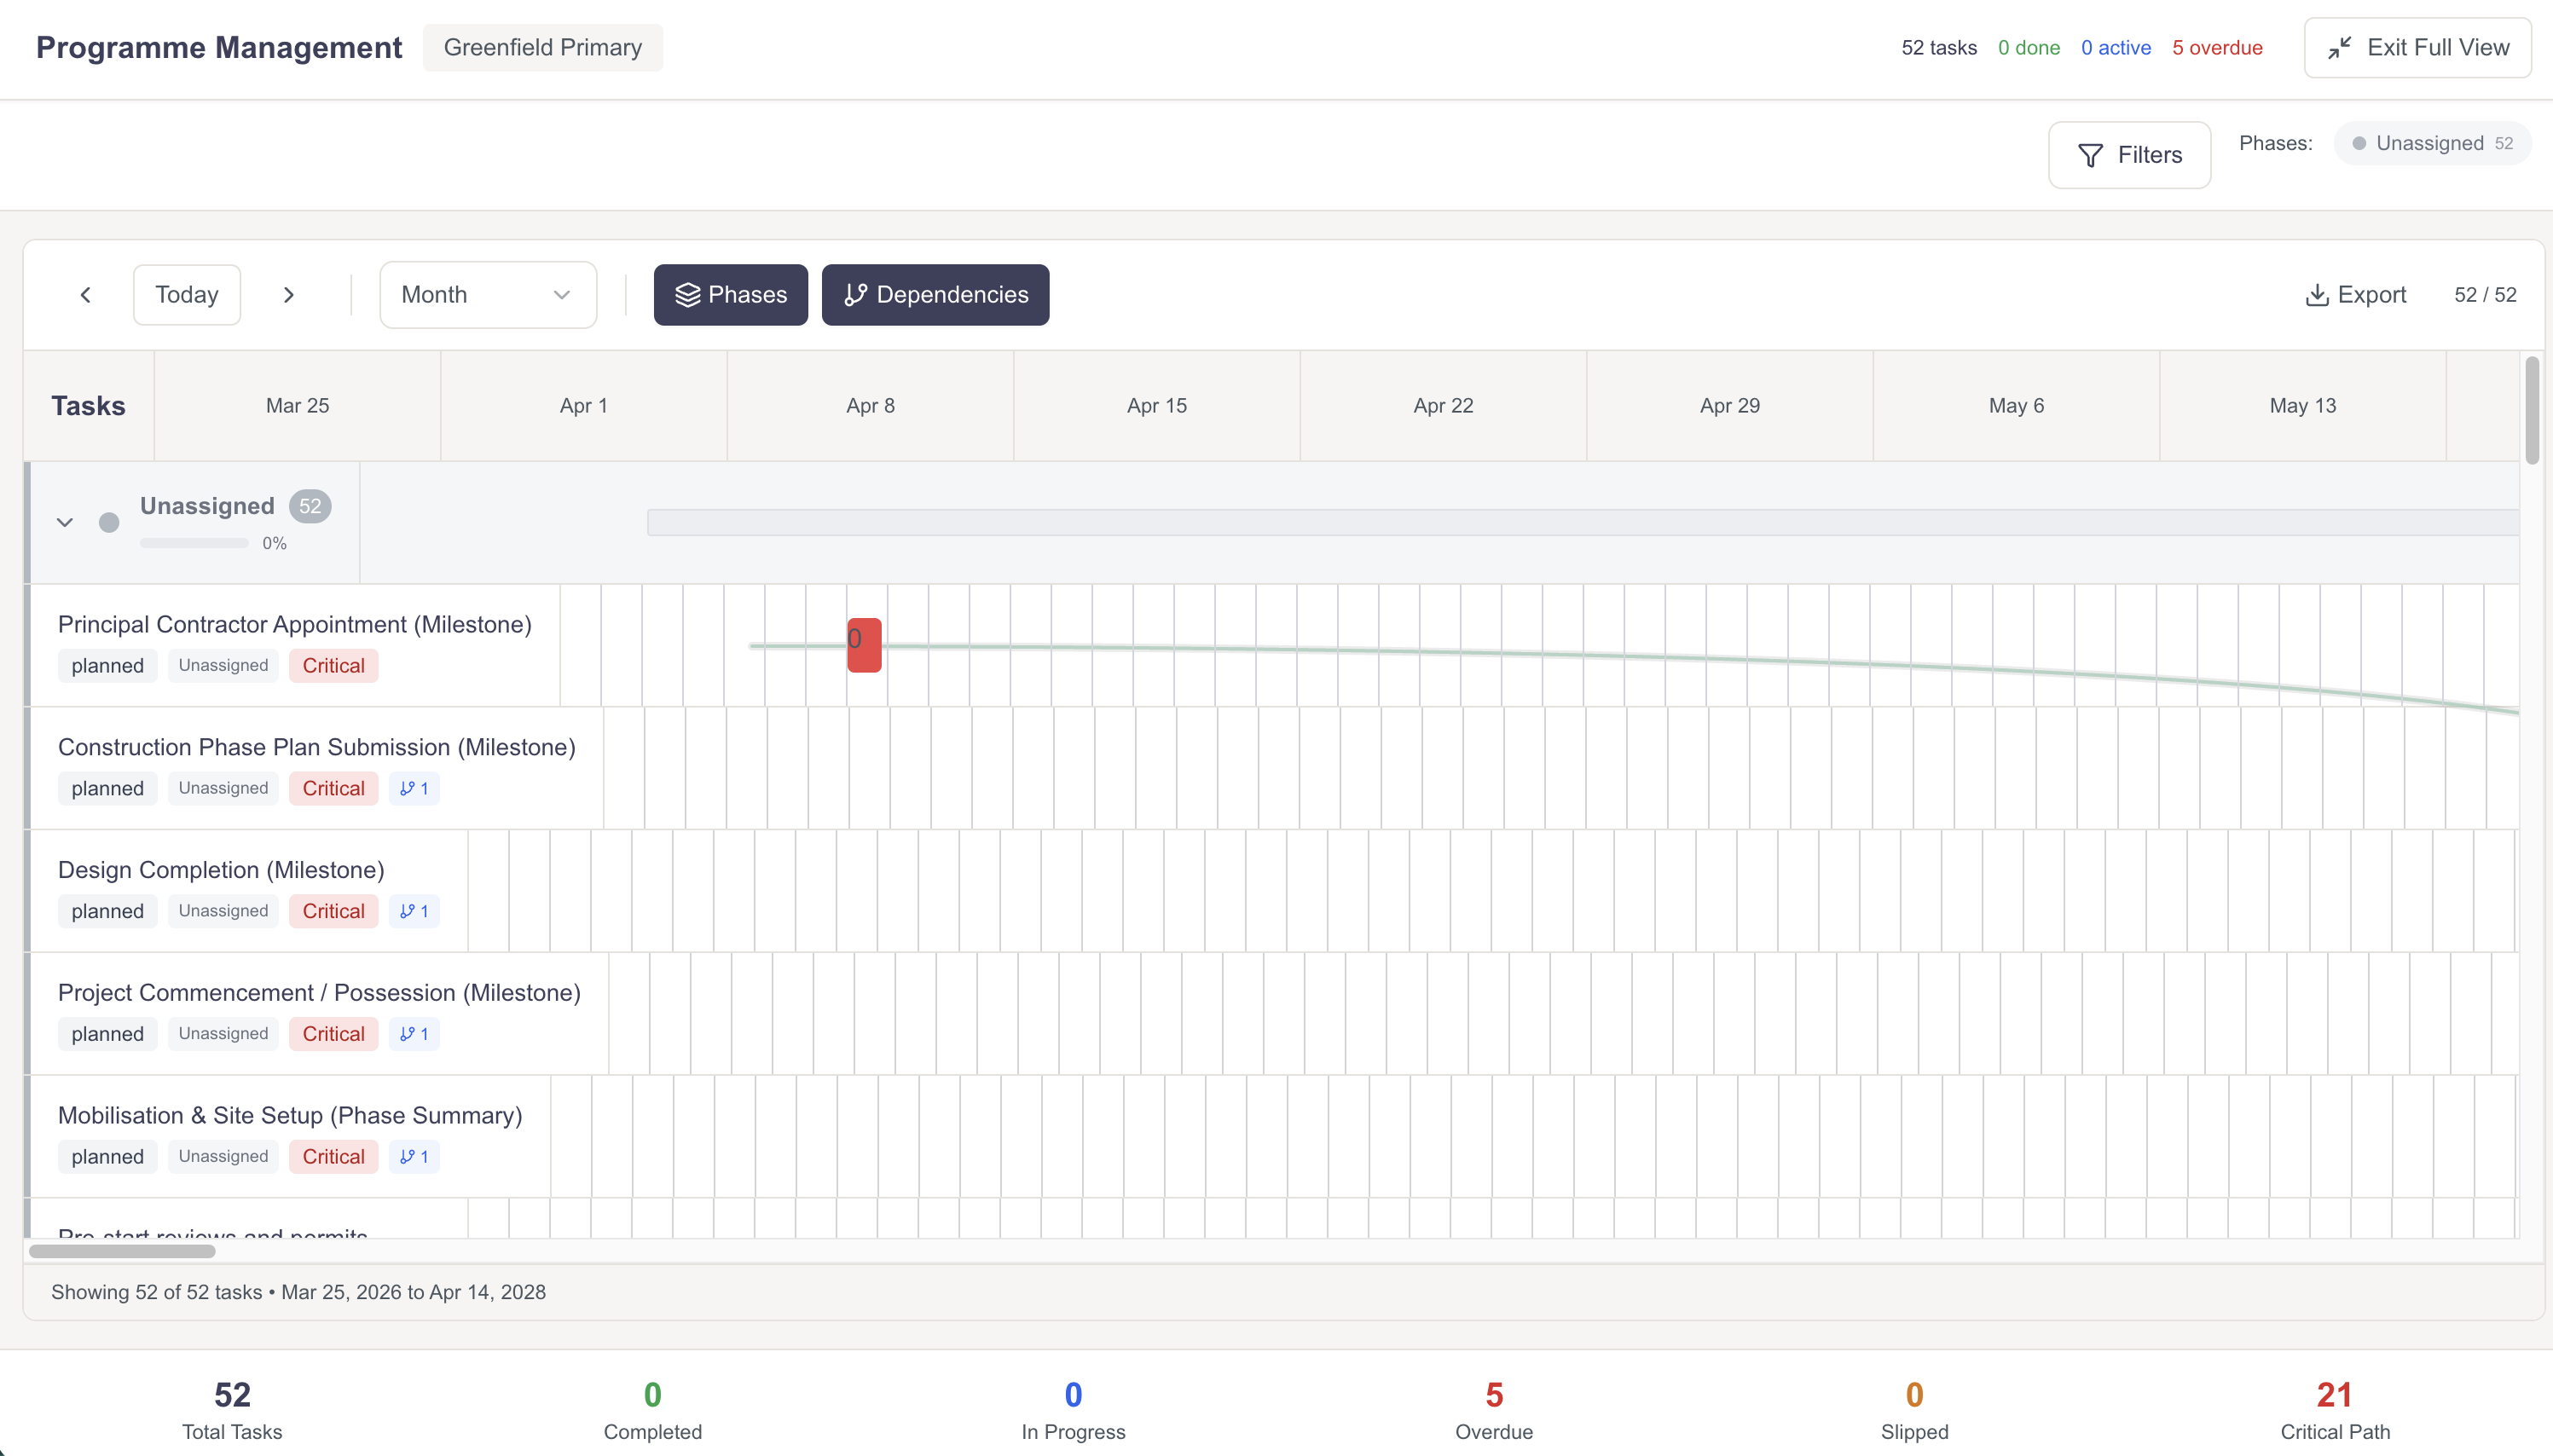
You can scroll left/right to see different time periods, and up/down to see more tasks.
Step 3: Adjust timeline view
Use the controls at the top to adjust the timeline granularity. Zoom in to see daily details, or zoom out to see the full project timeline at once. This helps you analyse schedule at different scales.
Step 4: Identify critical path
Tasks highlighted in red form the critical path - the sequence of tasks that determines the minimum project duration. Any delay in critical path tasks delays the entire project. Focus on these tasks first.
Video Tutorial
Related Tasks
Last updated: 2025-12-08